Why a 99% availability figure can still hide a real energy shortfall - and how to find it.
The monthly report says plant availability is 99%. Yet the energy delivered to the grid is clearly below forecast. Is equipment failing quietly? Are the modules underperforming? Or is the comparison in error?
The choice is crucial, because different causes require different solutions. One can't remedy an erroneous irradiance sensor simply by replacing an inverter. Cleaning modules will not recover energy lost during a grid shutdown. And an availability percentage, on its own, says very little about how much energy - and revenue - was actually lost. The first thing is to break down the shortage into specific, measurable causes that can be studied and attributed correctly. Floating solar brings access, mechanical, and environmental considerations to bear on the analysis, but the starting point is always the same: operating data.
The Original Situation: A Typical Shortfall on Water
Consider a composite example drawn from the kinds of issues operators commonly report on reservoir-based plants. It is illustrative and does not describe a specific Floatex project.
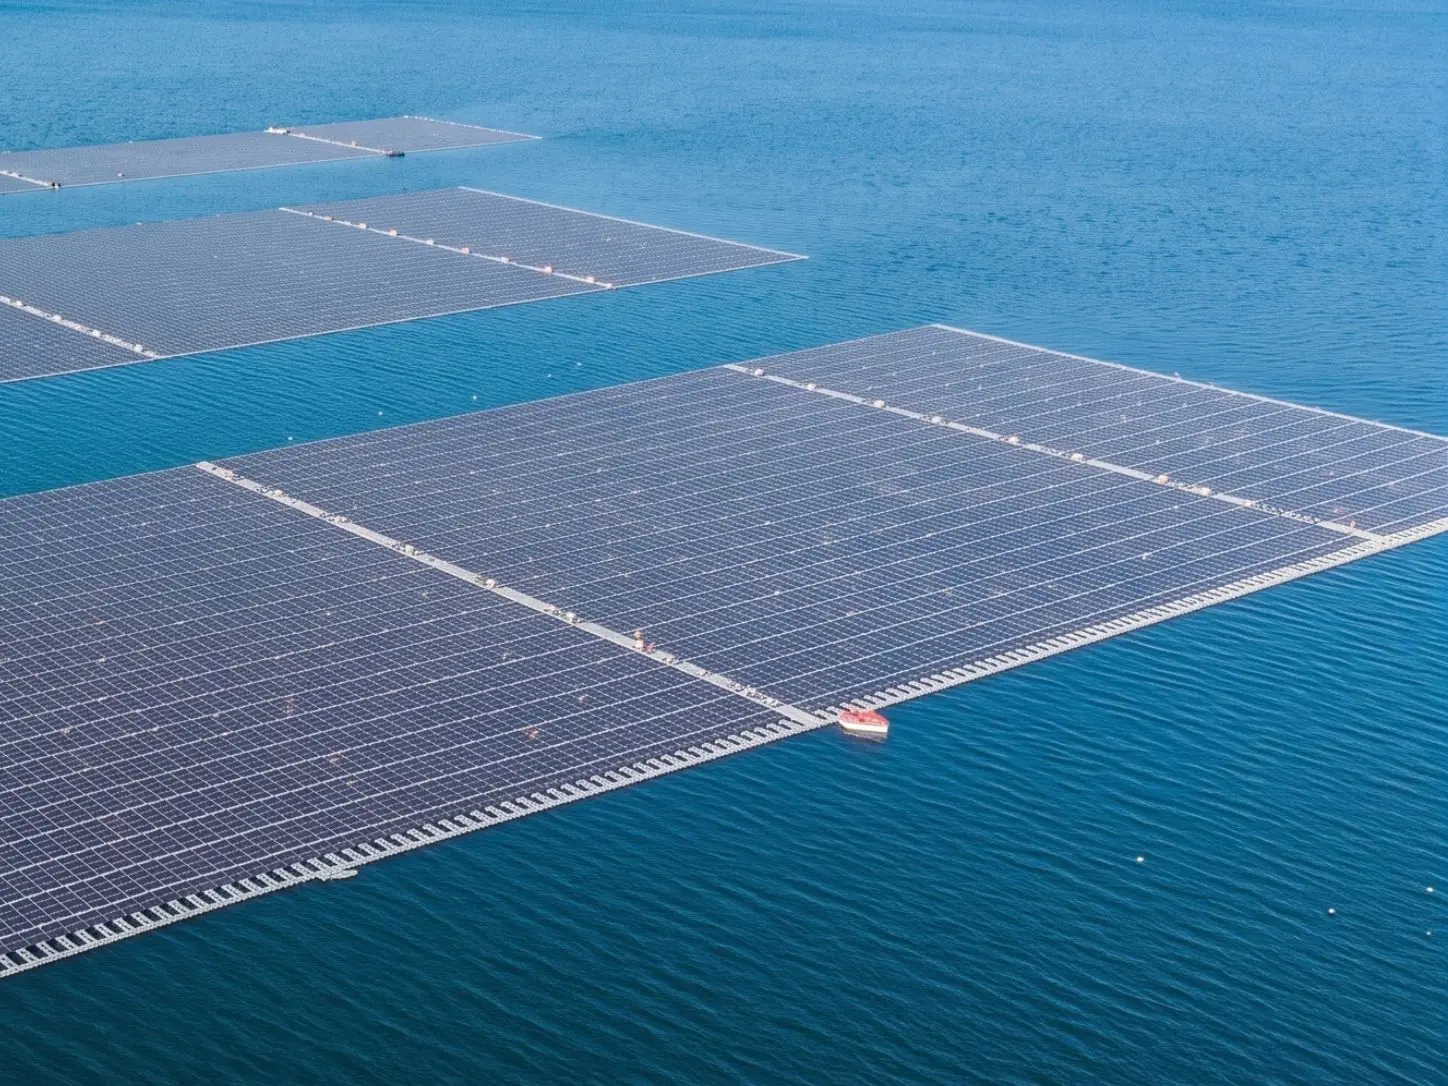
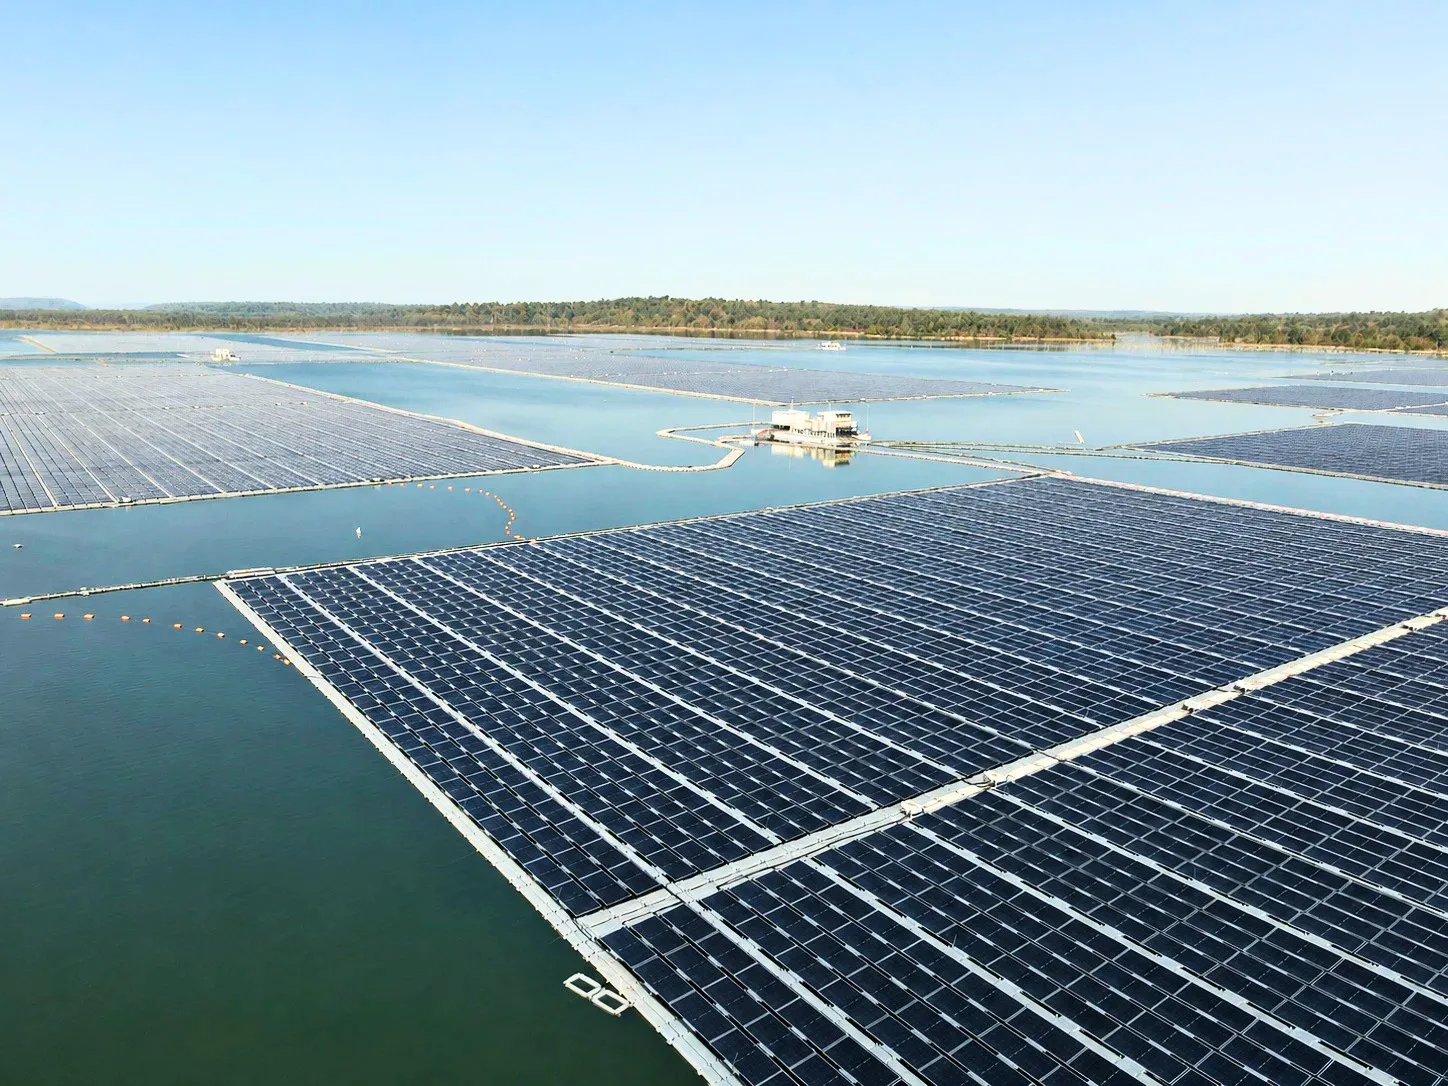
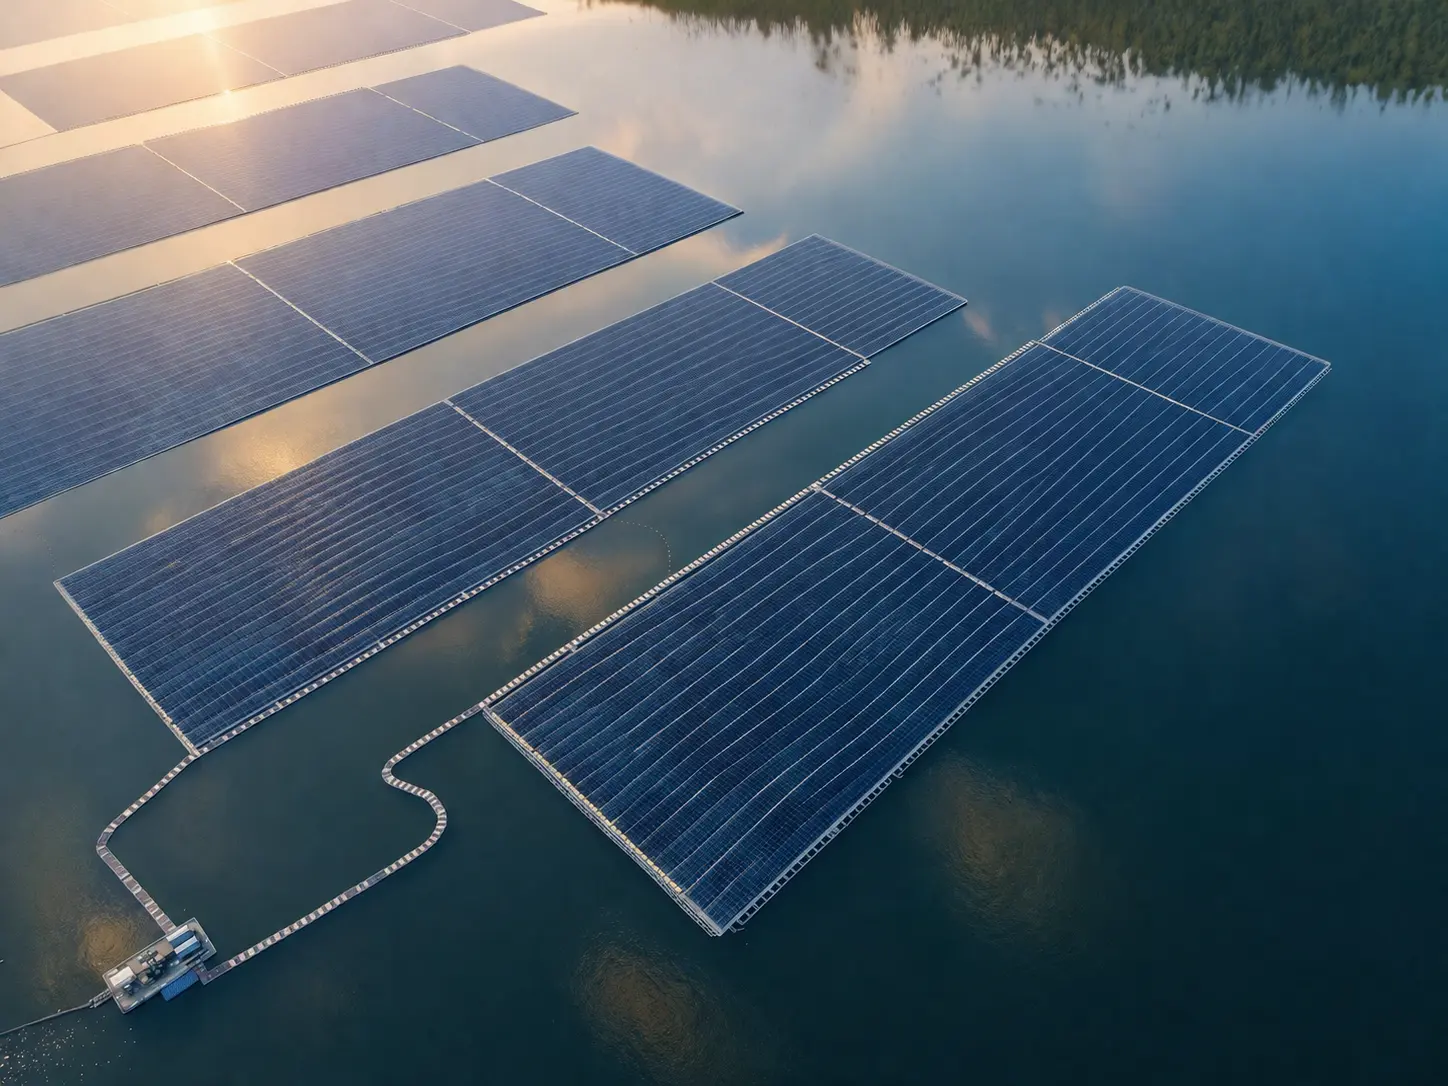
A utility-scale floating plant reports 99% time-based availability for the month, but metered export is several percent below the budget. The first reaction is to suspect the floats or the modules. A structured review instead finds several smaller causes adding up:
- Weather: The month was cloudier than the typical-year forecast, so part of the "loss" was never available in the first place.
- Sensor error: Bird droppings on the reference pyranometer made measured irradiance read low on some days and distorted the performance ratio.
- Restrictions: The grid operator restricted export for several hours during mid-day when power production was possible but the export was not permitted.
- Faults: Faults in the electrical strings were due to moisture at the junctions close to where the floating cables join the shore.
- Delay in fixing: One of the faults in the inverters was immediately found, but the delay in accessing the boat caused by strong monsoon winds caused prolonged downtime.
The Reality Check: Common Assumptions vs. What the Data Shows
| Common assumption | Reality | Better approach |
|---|---|---|
| "99% availability means the plant is healthy." | Availability is based on time, not energy. An outage for a short period during midday may be more costly than one for a longer period in the morning. | Track energy-based losses alongside time-based availability. |
| "Low PR means dirty modules." | Temperature, curtailment, outages, sensor errors and model boundaries all affect PR. | Validate data and separate causes before sending a cleaning crew. |
| "Floating arrays stay clean because there is no dust." | Bird feces and residues from water may be an important source of soil on reservoirs. | Assess soiling on-site and plan the cleaning and bird discouragement. |
| "Water cooling guarantees higher yield." | The cooling benefits depend on the climate and other factors and are not always the same percentage. | Use measured module temperature in the expected-energy model. |
| "A fault on water is fixed as fast as on land." | Repair will require the use of a boat, good weather windows and special platforms. | Log the delay in obtaining records separately and plan spares and manpower accordingly. |
General field observations; specific results will depend upon the site, design and contract.
First, Define What Has Actually Been Lost
The term generation loss refers to the difference between the predicted and real production. For diagnosis, it helps to separate four categories:
- Performance loss: Equipment is available but produces less than a weather-adjusted expectation - for example, due to soiling, shading, degradation, mismatch, temperature effects or electrical derating.
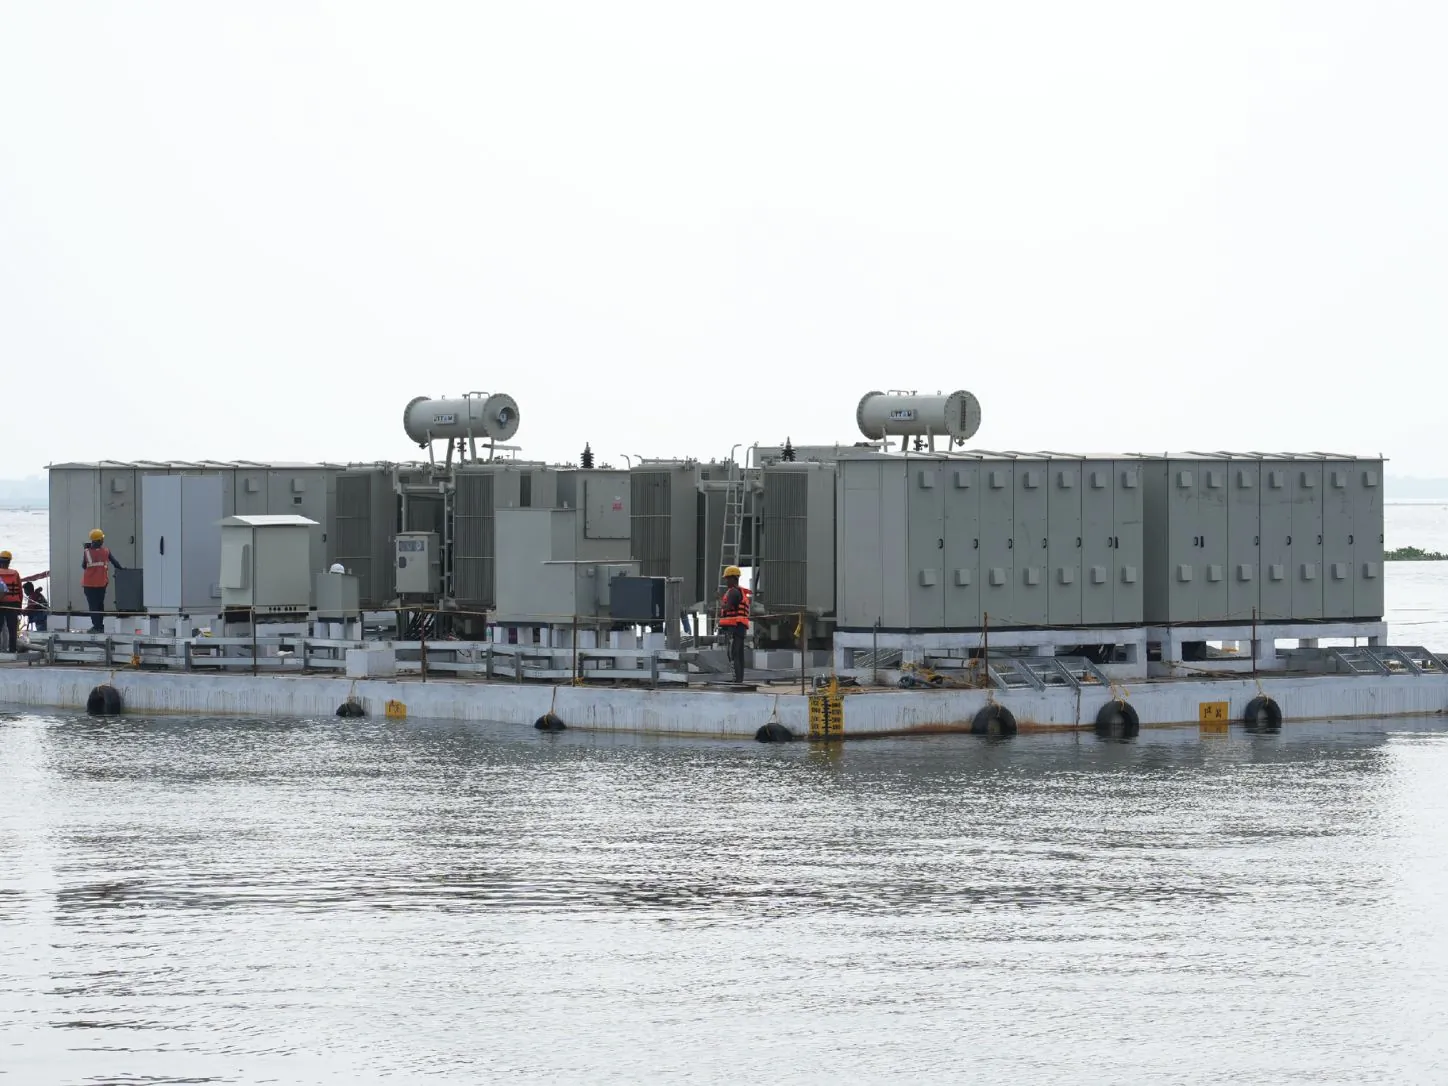
- Availability losses: Losses due to lack of availability of equipment, such as inverter trip, isolated feeder or transformer failure. Partly derated equipment should conform to the reporting guidelines outlined in the contract.
- Curtailment or Grid Loss: The plant had the capacity to produce power but was constrained by dispatch instructions or network constraints. Since these two types of events are treated differently in contracts, they should not be confused for equipment failure.
- Data/Monitoring Uncertainty: A faulty sensor, incorrect time stamps, incorrect meter multiplier or incorrect baseline can show a non-existent shortfall as real or mask a real shortfall.
| Observed symptom | Likely explanation | Evidence to check first |
|---|---|---|
| One inverter at zero output in strong sun | Equipment unavailability | Inverter alarms, breaker status and event timeline |
| Strings consistently below comparable neighbours | Performance loss | Irradiance, string current, shading and soiling records |
| Plant output follows a flat ceiling | Curtailment or export limit | Grid instructions, controller setpoints and POI meter |
| SCADA yield drops but revenue meter is steady | Data or measurement problem | Meter reconciliation, sensor health and timestamps |
| Plant online but output limited | Partial derating or control limit | Available power, component status and contract rules |
An investigation framework - not a substitute for contractual loss-allocation rules.
High Availability Does Not Prove High Generation
Time-based availability answers the question, "Was the equipment available during the time period that was evaluated?" The energy performance asks a completely different question: How much energy was delivered compared with what could realistically be produced?
The two measures can vary widely as the amount of solar radiation is not constant over the period of the day. Consider an example where a block went offline during two daylight hours. If it was expected to deliver 25 MW on average, it loses 50 MWh. But even if this occurs at the period when the expectation is 5 MW, it means a loss of about 10 MWh. The period was the same, but a fivefold variance in losses.
Projected power depends on real weather, layout, and operating limits of the plant. Multiplying nominal capacity by outage time can grossly overestimate the losses.
IEC TS 63019 offers classification of PV plant availability states, and IEC 61724-1 describes performance-monitoring nomenclature, instrumentation, and methods. This gives some common grounds, but specific calculation in each project must conform to its technical documentation and contract definitions.
Build a Defensible Expected-Energy Baseline
Saying a plant is "below forecast" means little without a clear reference. Pre-construction yield models use a typical weather year, not the weather the plant actually experienced. Comparing the energy produced by one month's meter against the budget could lead to a confusion between a cloudy month and a problem.
The operational assessment should determine the expected energy produced based on measured or validated irradiation, temperature of the environment and module, as well as the actual system design and a model of normal losses. After that, the comparison should be done based on equal parameters: inverter AC output vs. expected inverter AC output, or energy exported at POI vs. expected model.
Data quality must be confirmed before any loss is allocated. Calibrate the irradiance sensor, clean it and check its positioning; in the case of a reservoir, a dirty or misaligned pyranometer is a usual hidden mistake. In addition, meter accuracy, communication problems and the synchronization of meters and the SCADA system should be checked.
The performance ratio (PR) is good for comparison of the output and the solar irradiation, but it cannot find the reason itself.
A low PR does not automatically mean dirty modules or a faulty floating structure.
Diagnose the Shortfall in the Right Order
Trace the energy flow from sunshine to the meter, and create an event-by-event log throughout, making sure the same loss isn't assigned to two causes.
- Validate your measurements: Reconcile revenue meters with SCADA data, review timestamps, and mark any discrepancies, including impossible irradiance and temperature readings.
- Use actual weather: Compute the expected production interval by interval using the actual solar resource, not just the annual budget.
- Capture hard outages: Capture outage start and restoration times for inverter, feeder, transformer, and protective device events.
- Account for external constraints: Use dispatch instructions, controller limits, and grid logs to determine how much energy was lost due to not being able to export it.
- Examine operational but underperforming assets: Compare string, combiner zone, and inverter performance under comparable conditions with regard to soiling, shading, mismatch, temperature and derating.
- Account for the remainder: Quantify model uncertainties and analyze unexplained losses without simply filing them into the easiest bucket.
If two events overlap - like an inverter failure while the plant is being curtailed - then a precedence rule must be defined to determine which category gets the loss. Contractual availability reports and technical diagnostic reports may legitimately show different allocations because they use different agreed boundaries.
Check Floating-Specific Causes - Without Assuming Them
Float plants require the standard PV electrical and performance testing, as well as analysis of the effects of the aquatic environment on exposure, accessibility, and condition. However, this does not imply that all deficiencies must be attributed to the float and mooring system; this is something that can be tested when the signs point in that direction.
- Cable and moisture: Analyze routing, support, float/fixed transition, connectors, and insulation resistance history where electrical problems persist.
- Movement and mooring: Analyze array alignment, connection wear, and mooring condition when alarms or shading variations occur with wind, wave, or water level variations.
- Soiling and local conditions: Do not assume floating arrays are cleaner. Measure and check for deposits of bird droppings, water, and others.
- Access and repair delays: Check whether a known fault took longer to fix because it needed a boat, a calm weather window or a special work platform.
The IEA PVPS review of floating PV highlights open questions around energy yield, degradation, environmental stress, monitoring and O&M. These should be investigated systematically rather than covered by an arbitrary "floating loss" percentage. Electrical findings should be reviewed together with float, mooring and safety-inspection records - and crews should be sent only after the fault is confirmed and a safe work plan is ready.
Reconstruct the Loss Without Double Counting
For each reporting interval, start from the expected energy under actual conditions. Then account for internal equipment outages, performance loss of running equipment and external restrictions. Everything else that remains is unquantified difference in either measurement or modeling.
In the case of an unavailable inverter, estimate the loss in production by using a typical model or healthy device.
For a derated string, compare it with matched strings under similar conditions - and explain why the comparator is valid.
| Loss category | Supporting record |
|---|---|
| Internal equipment unavailability | Fault code, isolation status, affected capacity, timestamps and expected interval output |
| Performance loss while available | Weather-normalised comparison, string/inverter data and engineering diagnosis |
| External curtailment | Grid instruction, controller setpoint, export limit and event log |
| Monitoring or model uncertainty | Calibration records, missing-data log and sensitivity analysis |
| Repair and access impact | Work order, mobilisation history, access restrictions and restoration time |
Apply the contractual allocation method separately where its definitions differ from this technical review.
The residual must remain visible on the report. It is possible to force the numbers to balance, making the report presentable, but it will conceal the error that needs to be found.
Turn the Diagnosis into Better Decisions
The aim is not just a final percentage, but the right next action. A persistent string-level loss needs a different response from repeated inverter trips. A grid constraint may need to be raised commercially rather than fixed on site. A monitoring fault may call for sensor cleaning or recalibration before any field work.
The findings should also feed back into future projects: cable routing and strain relief, access provisions, float-connection inspections, spare-parts planning, weather windows and monitoring design.
A good monthly report should clearly state:
- What happened.
- Why it happened.
- How much energy was lost.
- What is still uncertain.
- Who owns the next step.
How We Approach It at Floatex Solar
At Floatex Solar, we work on floating solar engineering and EPC - float structures, anchoring and mooring, electrical integration and site analysis. As we view the plant in terms of its physical structures as well as its electricity, we have to consider the underperformance in terms of both of these areas.
Conclusion
A single figure cannot represent underperformance, but there may be multiple reasons for it. The most important thing is to identify the reason for the problem, whether it resulted from downtime or low productivity during operation or was due to any other factor.
Once these are separated, the corrective action can be targeted - and the plant can recover the energy that is actually recoverable.